

What Does a HubSpot Website Actually Cost?

Your HubSpot Site Is Slow. Check the Templates Before Blaming the Platform.
Search Console says your mobile pages are Poor. Someone shares a red PageSpeed score. Now you're explaining website performance in a meeting that was supposed to be about pipeline.
Is HubSpot the problem? Do you need a redesign? Can somebody just fix it?
Start with the pages, templates, images, and scripts your visitors actually load. A slow HubSpot site doesn't, by itself, establish that the platform is the cause—or that replacing the website is the right response.
You need to know what is failing, how widely it affects the site, and whether a shared fix can resolve it.
Core Web Vitals should also be kept in perspective. Google has said they are not major ranking factors, so a poor CWV report is not a reason to expect a dramatic loss in search visibility—or to chase perfect scores at any cost. They are still useful measures of real user experience and poor results can expose loading, responsiveness, or layout problems worth fixing.
Summary
- HubSpot Core Web Vitals problems often involve oversized media, template code, fonts, or third-party scripts.
- Diagnose the failing metric and affected templates before approving a redesign.
- PageSpeed Insights includes both real-user data and lab tests. The Lighthouse score is not the same as passing Core Web Vitals.
- Fix shared issues first, then measure whether visitors experience an improvement.
- Rebuild when the existing theme makes reliable fixes or routine editing impractical.
What Poor usually means on a HubSpot site
Core Web Vitals measure loading, responsiveness, and visual stability. They give you a more specific starting point than “the site feels slow.”
| Metric | What visitors experience | Good threshold |
|---|---|---|
| Largest Contentful Paint, or LCP | How long the largest visible image or text block takes to appear | 2.5 seconds or less |
| Interaction to Next Paint, or INP | How quickly the page visually responds to an interaction | 200 milliseconds or less |
| Cumulative Layout Shift, or CLS | How much visible content unexpectedly shifts | 0.1 or less |
Google evaluates these thresholds at the 75th percentile of visits, separating mobile and desktop. All three need to meet the Good threshold for a passing assessment. Google's Web Vitals overview explains the metrics.
On a HubSpot site, five patterns are worth investigating:
- Oversized hero media. A phone downloads an image intended for a large desktop display, or a background image starts loading late.
- Too much shared styling. Pages load CSS for modules they never use, adding unnecessary work before content appears.
- Accumulated scripts. Chat, tracking, video players, overlays, and old integrations compete for browser time.
- Heavy font loading. Multiple families and weights add downloads and can delay text or cause shifts.
- Expensive shared components. A navigation system, blog slider, or animation affects every page using the same template.
These are starting hypotheses. A useful audit tests them and identifies the actual cause. It shouldn't turn a list of common problems into an automatic recommendation to replace your theme.
Navigator Business Solutions: a rebuild with a measurable reason
For Navigator Business Solutions, the problem extended across performance and the editing experience. The solution was a ground-up rebuild inside HubSpot using a heavily customized Sprocket Rocket Pro theme.
We rebuilt 56 site pages, optimized images and video, and cleaned up legacy markup and unnecessary scripts. The project also gave the team reusable modules and a cleaner way to manage content.
Afterward, all 115 affected mobile URLs moved from Poor to Good in Google Search Console. Core Web Vitals passed on desktop and mobile.
That outcome supports rebuilding when problems are structural. It doesn't mean your own red report requires the same scope.
What to fix before anyone talks redesign
Start with a representative page from each affected template group: a service page, a blog post, a resource page, and the homepage where relevant. Look for shared causes before paying to fix each URL individually.
1. Identify the element and delay behind LCP
The largest element may be a hero image, headline, or another visible component. Don't assume it is always the image at the top.
Ask your developer to show what is slow: the initial response, discovering the resource, downloading it, or displaying it. Compressing an image won't resolve an animation that keeps the finished image hidden.
Google's LCP optimization guidance breaks down those delays. Your proposal should identify which one the work addresses.
2. Give the main content an appropriate loading path
For an image that drives LCP, serve appropriately sized versions and use effective compression. Where suitable, an image element in the initial HTML makes discovery and responsive sizing easier than a CSS background.
Avoid lazy-loading that main image. A high fetch priority can help; preload is useful when discovery is otherwise delayed. Neither should be applied indiscriminately to every image on the page.
3. Reduce styling and font work that blocks the page
Check whether each page receives a large collection of styles for unused modules. Removing unnecessary CSS can matter more than changing the image format again.
Review fonts at the same time. Keep the families and weights the design actually needs. Preload a critical font only when testing shows it helps; extra preloads can compete with the content you're trying to prioritize.
4. Review scripts against their purpose
Ask who owns each third-party tool, which pages need it, and when it needs to run. Remove abandoned tags and limit optional widgets where practical.
Deferring a script can reduce initial loading work, but it may still cause slow interactions later. Test both loading and real actions such as opening navigation, filtering resources, and submitting forms.
Keep consent behavior and measurement requirements intact. Moving everything into Google Tag Manager can make ownership clearer and maintenance easier, but it doesn't automatically make those scripts more performative.
5. Prevent content from shifting
Reserve appropriate space for images, embeds, and forms. Check cookie banners, font changes, and late-loading content that pushes a button away just as someone tries to use it.
Fix the shared component where possible. A stable form module can help many landing pages at once.
6. Reassess before expanding the project
Confirm that changes improve controlled tests and then watch the field data. If the site meets its performance goals and remains easy to edit, there may be no reason to invest in a rebuild.
Ongoing HubSpot website optimization can then focus on preventing regressions and improving the pages that matter commercially.
Quantum Workplace: faster demo pages, with a maintenance tradeoff
For Quantum Workplace, we optimized eight demo and campaign pages serving organic and paid traffic. The work focused on those pages rather than a full website rebuild.
In the captured PageSpeed Insights tests, the main demo page’s mobile performance score improved from 75 to 100, while mobile Largest Contentful Paint fell from 6.6 seconds to 1.7 seconds. Other examples included the engagement demo page improving from 76 to 97 and the performance demo page from 55 to 95.
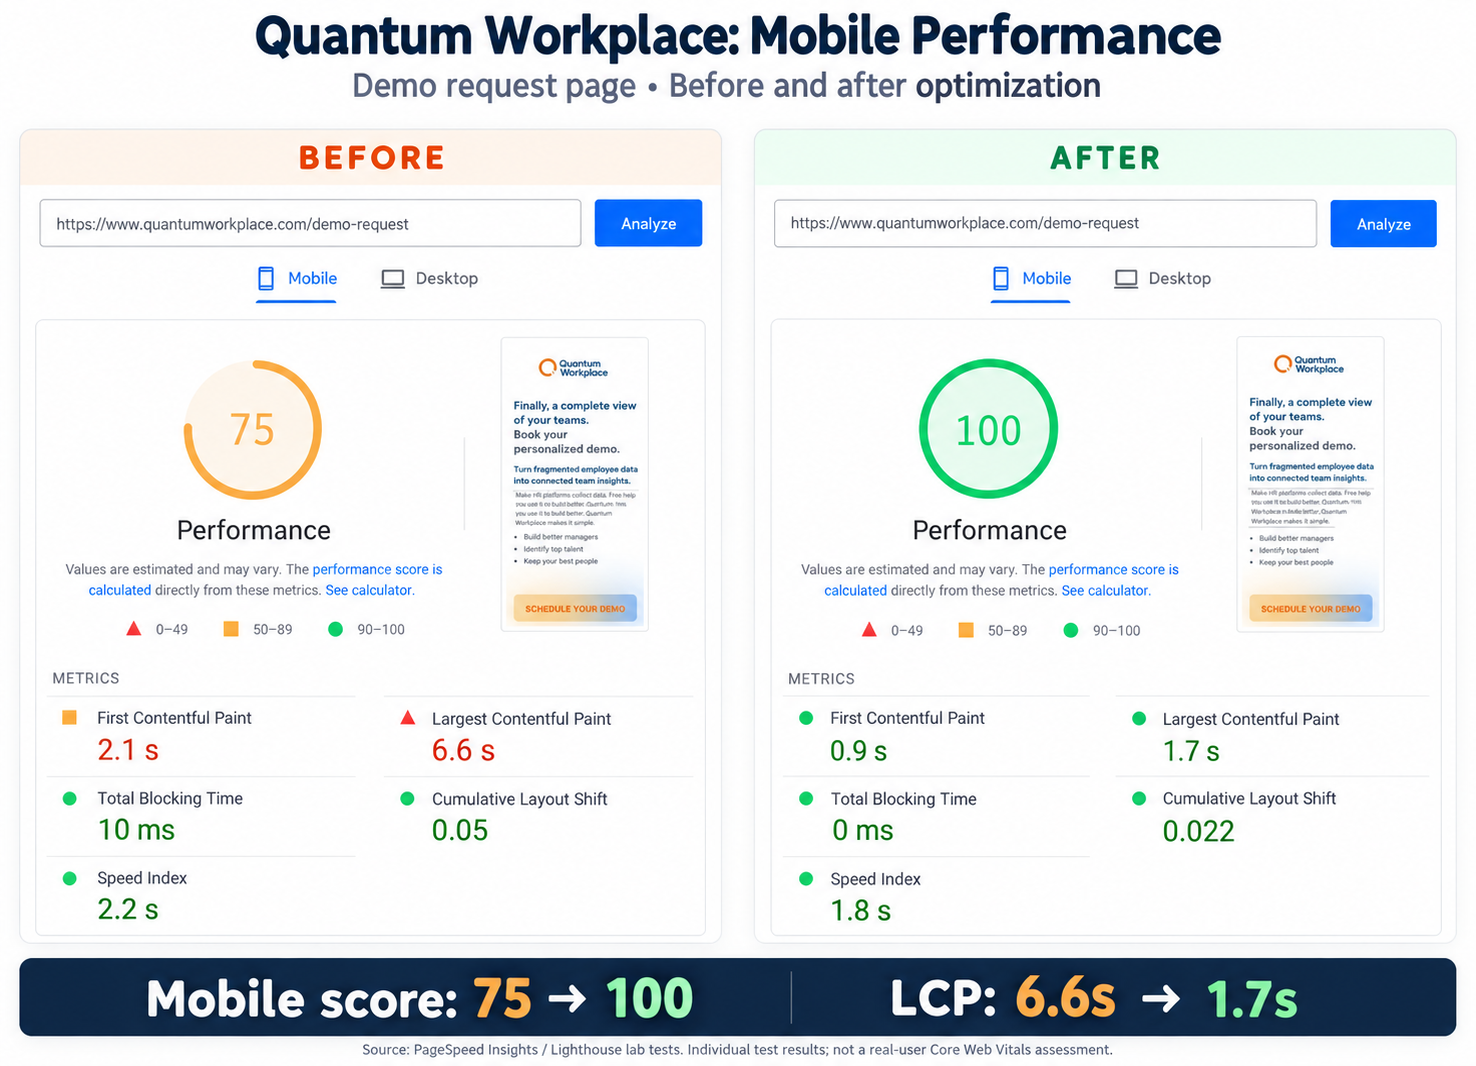
Achieving those results required tighter control over what loaded on the pages and when. We implemented a custom approach to script loading rather than relying on the normal global header-code settings.
That introduced a maintenance tradeoff: adding or changing third-party scripts on these templates now requires developer involvement. The marketing team cannot assume that scripts added through HubSpot’s global header settings will automatically appear on these pages.
This approach can make sense for a defined set of important landing pages with ongoing development support. It is less suitable when your marketing team needs to manage those integrations independently.
When you do need a rebuild
A rebuild becomes reasonable when fixing the current theme repeatedly runs into the same structural problems.
That might mean image handling requires changes across dozens of unrelated modules. Or the site has accumulated one-off coded layouts that nobody can update consistently. Or performance remains poor after targeted fixes because the underlying rendering and script behavior is difficult to change safely.
The editing experience matters too. If routine content updates break layouts or undo performance improvements, the problem extends beyond one slow page.
Ask for a comparison: what would repairing the existing system involve, and what would rebuilding replace? Both options should address the same requirements so the tradeoff is clear.
A high URL count alone isn't enough. Hundreds of pages sharing a few templates may be easier to improve than a much smaller site with inconsistent code on every page.
HubSpot-specific traps worth a 15-minute look
-
Global includes: Are scripts or styles loading across the whole site for a feature used on only one page?
-
Chat widget timing: Does HubSpot chat need to load immediately? If chat isn't critical during the initial page load, delaying it by several seconds can reduce the amount of work competing with your primary content.
-
Custom module assets: Does a module load its own requirements appropriately or has everything been added to a global file?
-
Images & video: Are media files appropriately sized, compressed, and optimized for how they’re displayed, or are unnecessarily large files slowing page load times?
-
Blog listing cards: Are cards using full-size images instead of sizes appropriate for their display?
-
Old dependencies: Is a legacy JavaScript library still needed? Check dependencies before removing it.
The result should identify which affected pages and issues deserve development time next.
How to measure without letting Lighthouse run the meeting
Use Search Console's Core Web Vitals report to understand affected groups and the direction of real-user performance. Use PageSpeed Insights and browser tools to investigate representative pages.
PageSpeed Insights has two distinct kinds of evidence: Chrome UX Report field data, where available, and a Lighthouse lab test. The lab score is useful for diagnosis, but a score of 90 isn't a guarantee of passing field metrics.
Check whether the field report represents the specific URL or the wider origin. Low-traffic pages may lack their own data. Missing data doesn't mean a pass or a failure; targeted testing and first-party real-user monitoring can fill gaps.
Search Console's report uses a rolling 28-day collection period. Record when changes go live and allow time for new visits to influence the results. You can verify a technical fix promptly without claiming the field report has already caught up.
HubSpot Core Web Vitals FAQ
Does HubSpot hosting cause poor Core Web Vitals?
Poor scores alone don't establish a hosting problem. Investigate response time alongside templates, media, fonts, and scripts. The appropriate fix depends on where the delay occurs, not simply which CMS hosts the page.
Will an accessibility overlay improve our scores?
An overlay isn't a Core Web Vitals fix. It adds code that should be measured like any other third-party script. Address accessibility issues in the underlying site and evaluate performance separately.
Can we fix speed now and redesign later?
Often, yes. Shared image, template, or script changes may improve the existing site. A rebuild becomes more compelling when those changes are impractical or the editing system keeps reintroducing problems.
How long until Search Console shows the improvement?
Expect the field trend to develop over weeks because the report uses a rolling 28-day window. Timing depends on incoming data and the issue being tracked. A better lab result on launch day doesn't immediately replace earlier visitor experiences.
Will passing Core Web Vitals increase traffic?
It improves a measurable part of the page experience, but it doesn't guarantee higher rankings or more leads. Evaluate traffic and conversions separately, alongside content relevance and the usefulness of the page.
Find out what actually needs fixing
If your mobile or desktop report is red, send us the Search Console screenshot and a few affected URLs. We'll help you identify what can be fixed in the current site and whether there is a sound reason to consider a rebuild.

Josh is the owner of Inbound Design Partners and a HubSpot & WordPress expert. With years of experience solving complex web challenges, he helps businesses build smarter, more effective websites. Have a question about making your website work better? Josh has the answers.